

<
>
-
关于我们
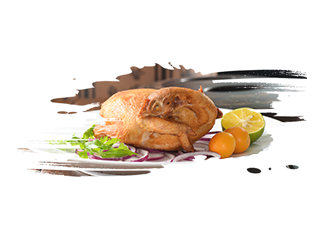
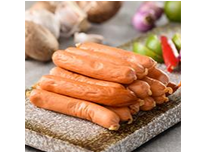
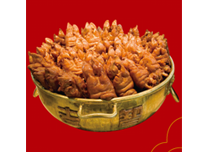
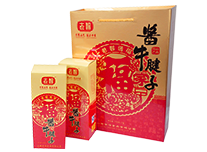
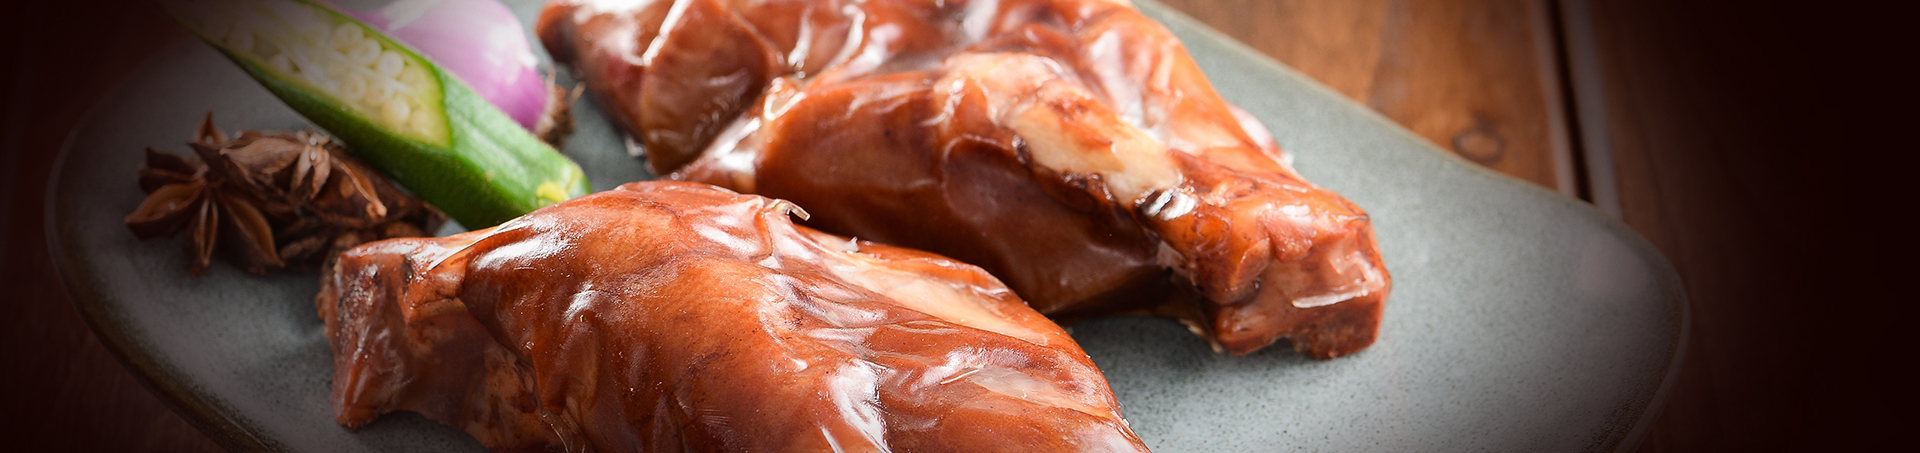
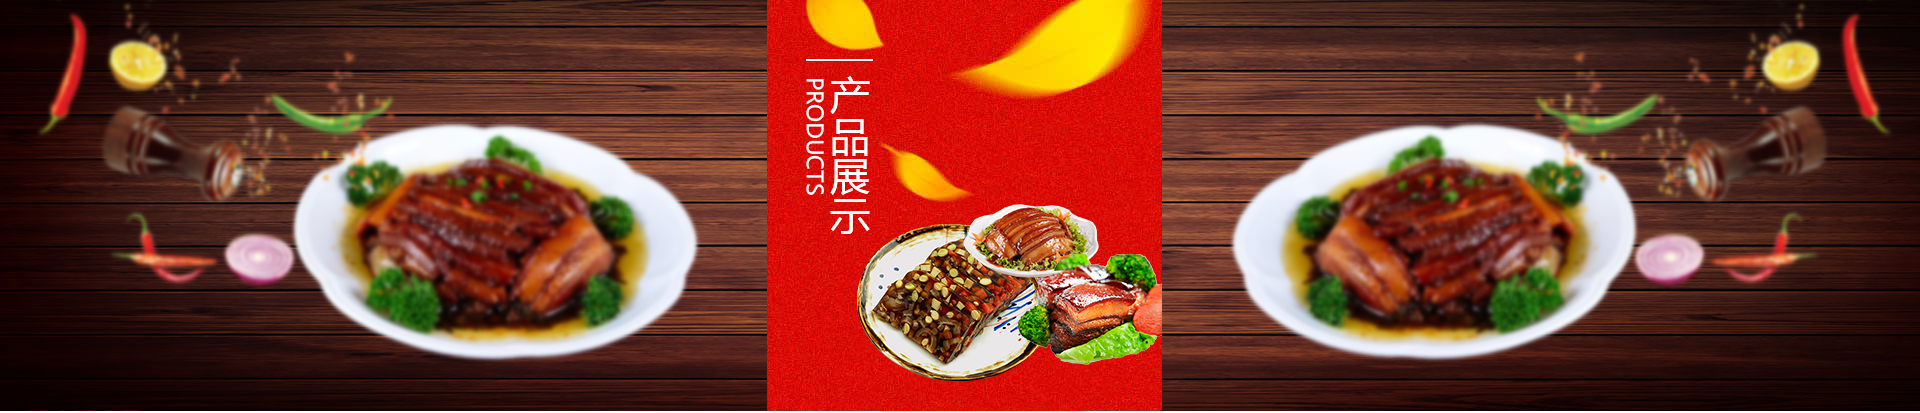
山西智泽食品有限公司,是专业生产和销售熟肉制品的现代化企业。经过二十年的发展,到目前为止,已形成“老智”牌四大系列共六十多个品种的熟肉制品,产品主要销售遍及山西、河北......

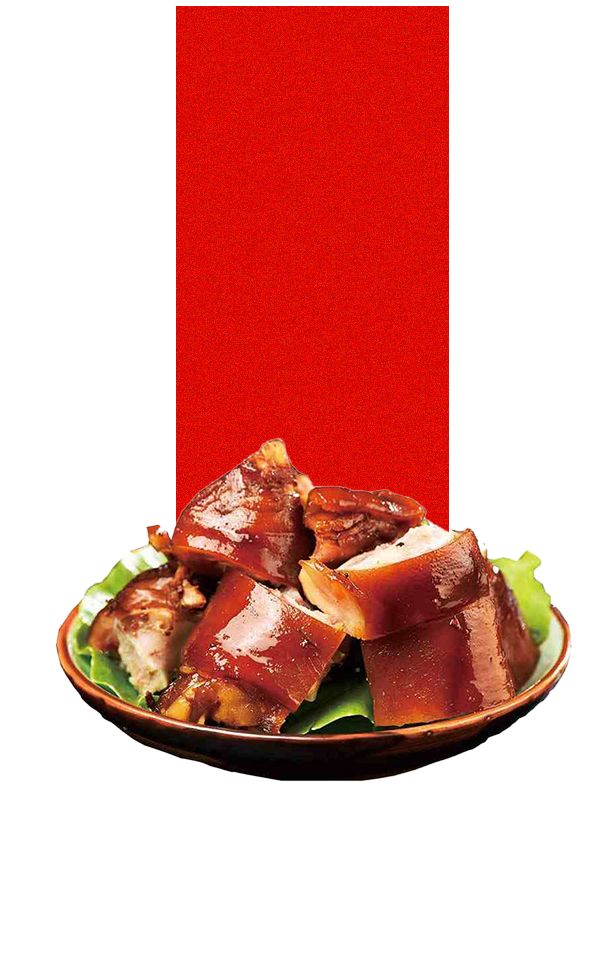

山西智泽食品有限公司,是专业生产和销售熟肉制品的现代化企业。经过二十年的发展,到目……
联系电话
0351-6380022
关于我们


版权所有:山西智泽食品有限公司 电话:0351-6380022 手机:13038005299
地址:山西省太原市尖草坪区大同路311号 晋ICP备13007194号-1
技术支持:龙采科技(山西)有限公司---百度山西地区营销服务中心(山西百度推广、山西网站建设)